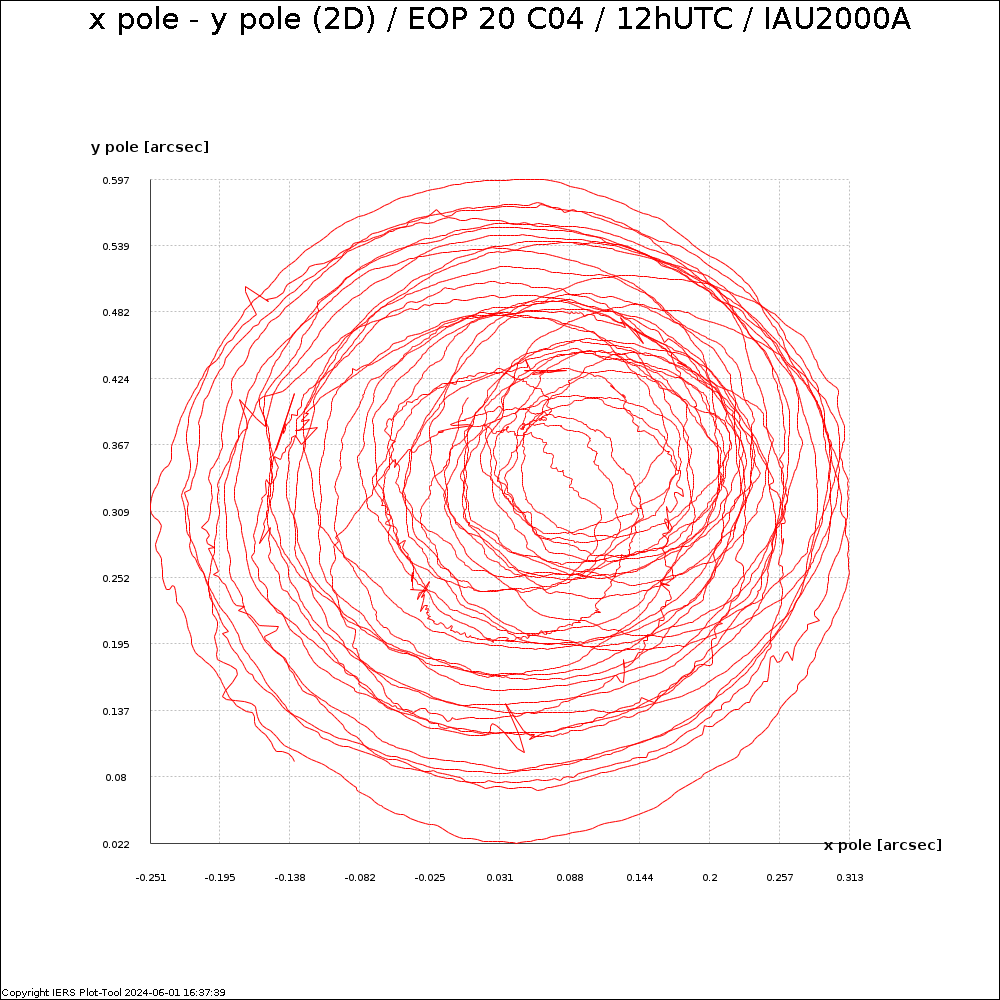
Plots for x pole - y pole (2D) - EOP 20 C04 (IAU2000A, dPsi, dEps) 12hUTC - one file (1984-now)
Interactive version of plotPlot as image
Decription of the data used for this plot
Interactive version of plot (JavaScript is needed):
Plot as image (JavaScript is not needed):