Plots:finals.data (IAU1980)
Please click on the pictures below to view the plots.
You can also configure your own plots of EOP data with the
IERS Plot Tool.
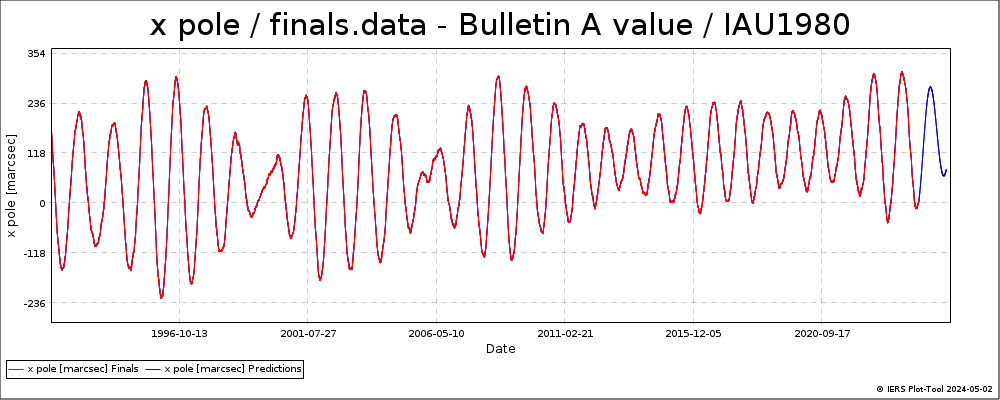
x pole - finals.data (IAU1980)
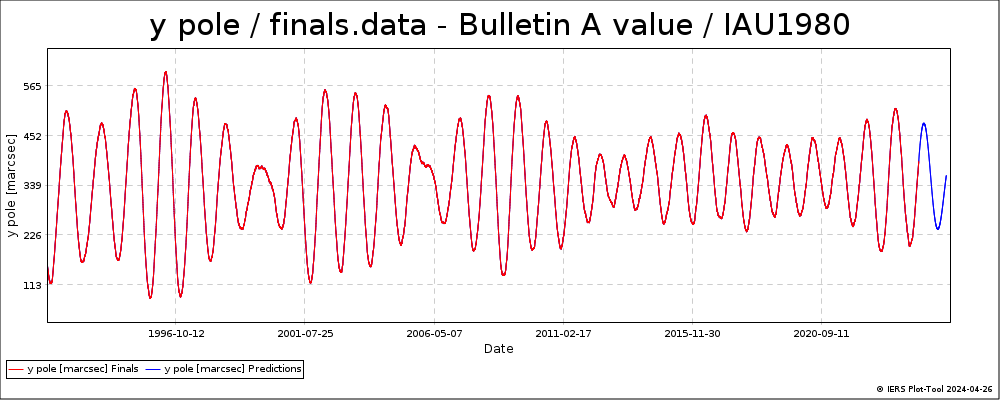
y pole - finals.data (IAU1980)
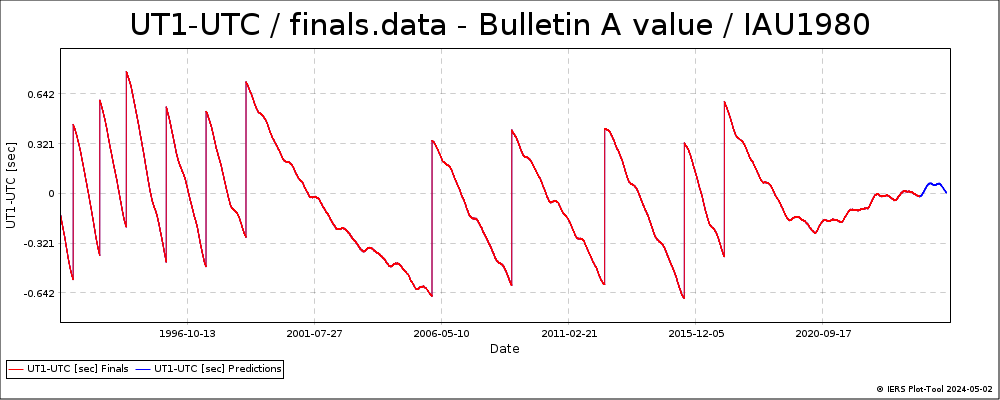
UT1-UTC - finals.data (IAU1980)
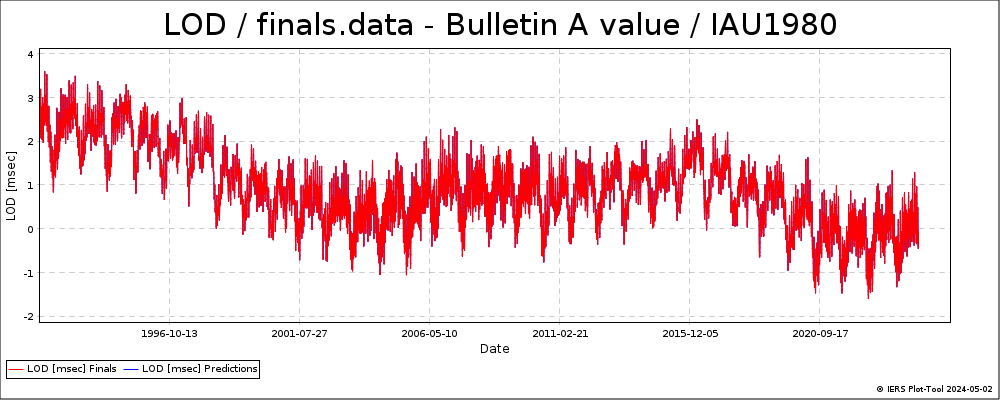
LOD - finals.data (IAU1980)
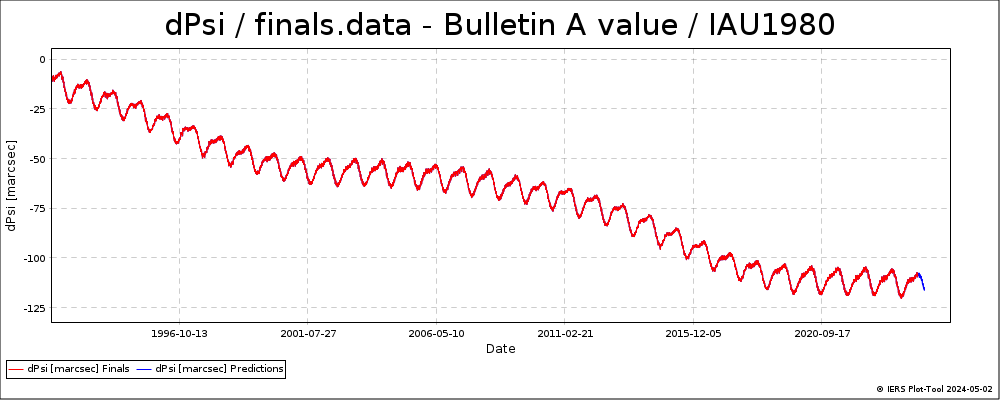
dPsi - finals.data (IAU1980)
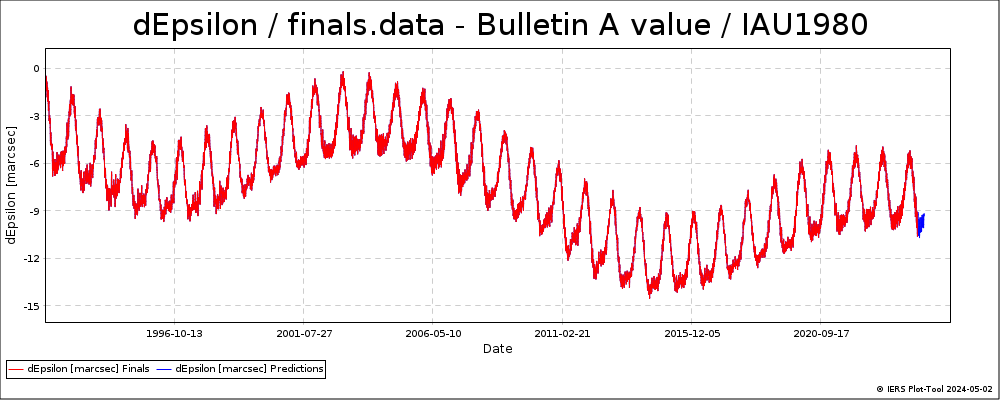
dEpsilon - finals.data (IAU1980)
x pole - y pole (3D) - finals.data (IAU1980)
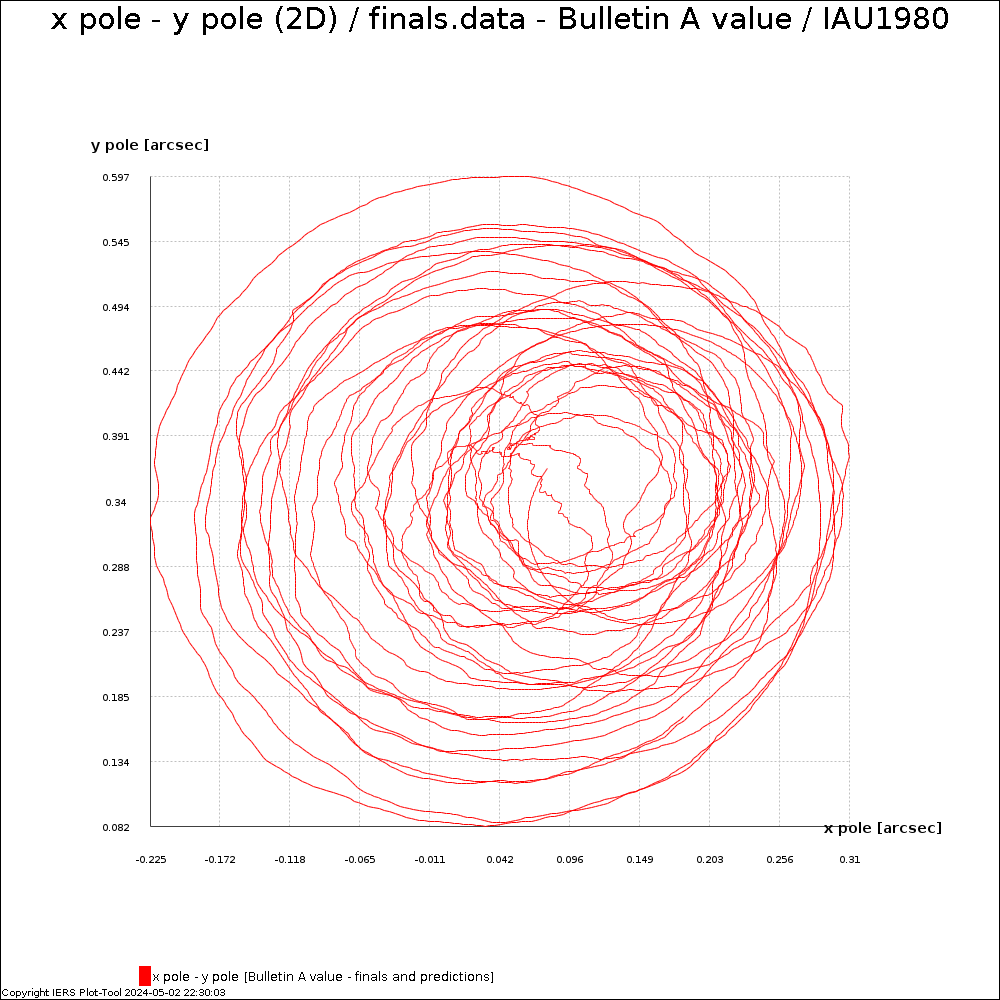
x pole - y pole (2D) - finals.data (IAU1980)