Plots:Bulletin B
Please click on the pictures below to view the plots.
You can also configure your own plots of EOP data with the
IERS Plot Tool.
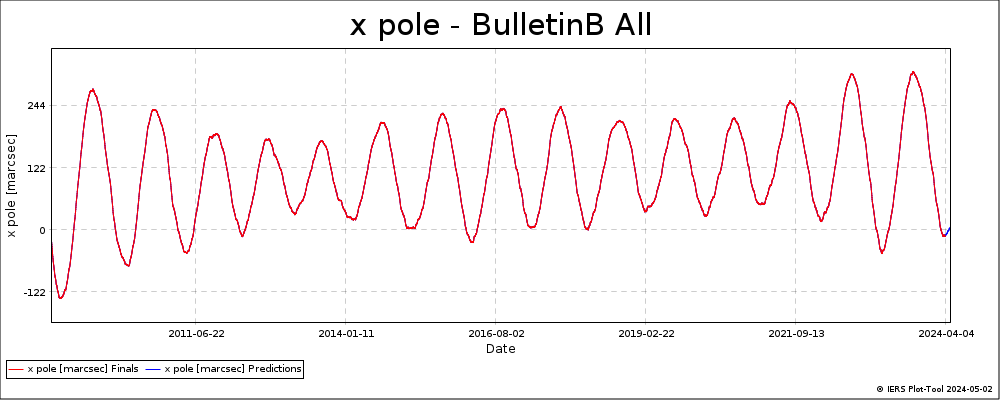
x pole - Bulletin B All
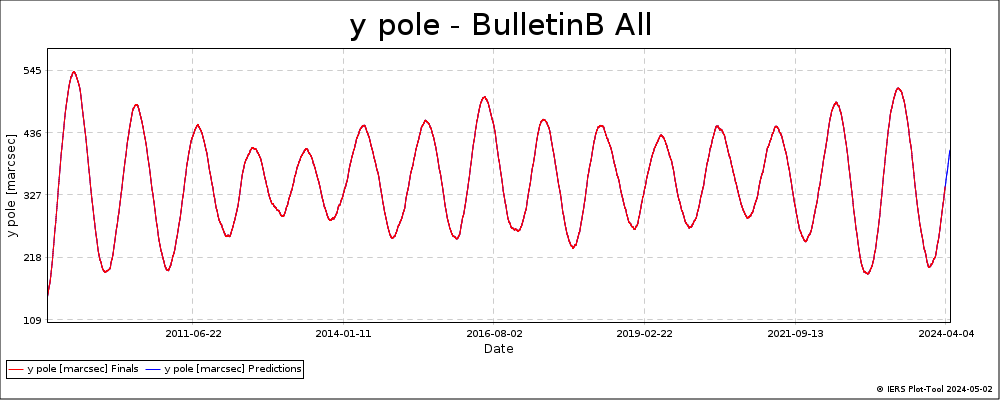
y pole - Bulletin B All
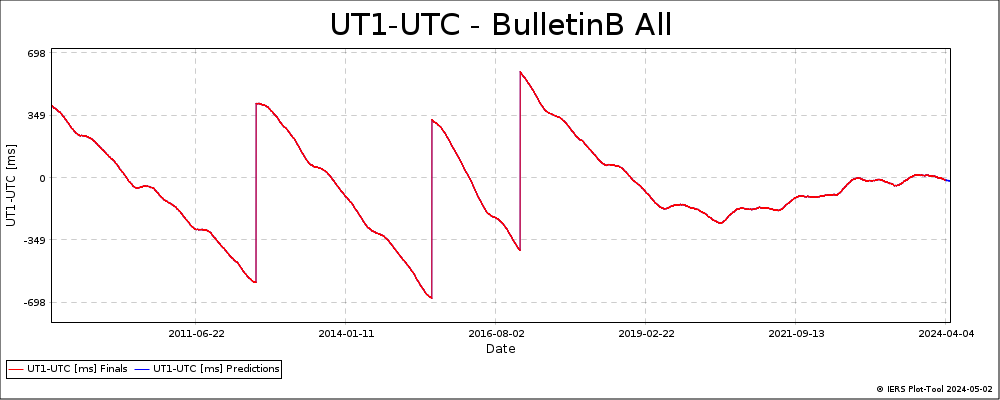
UT1-UTC - Bulletin B All
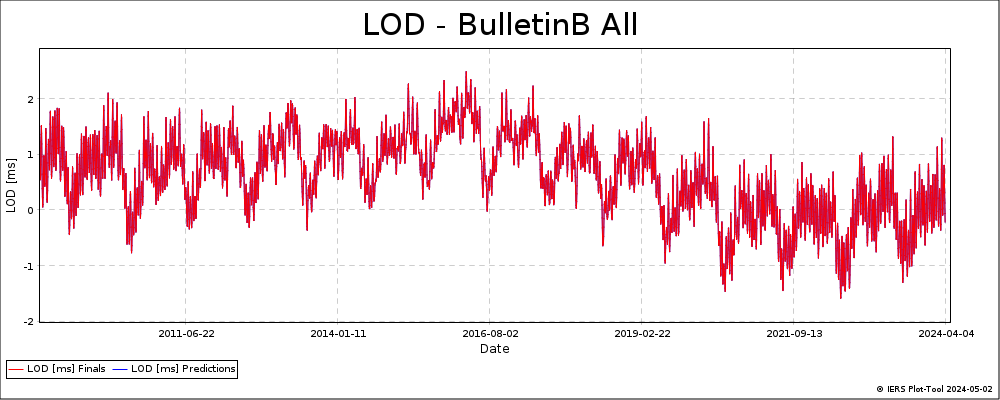
LOD - Bulletin B All
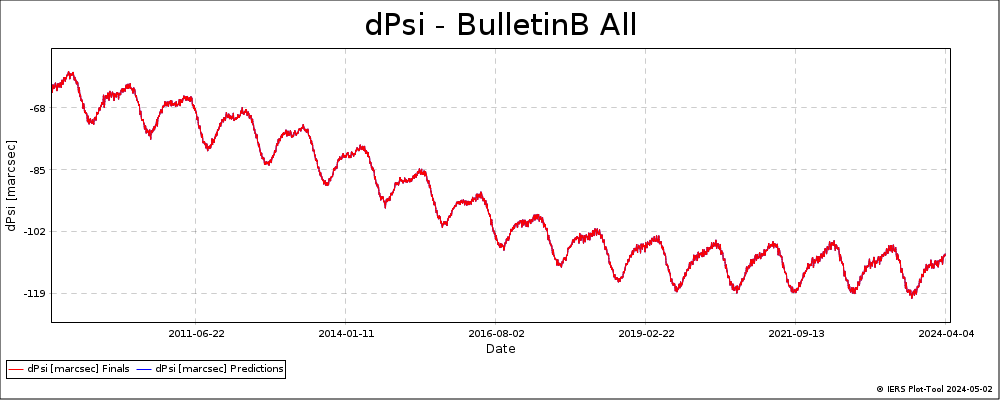
dPsi - Bulletin B All
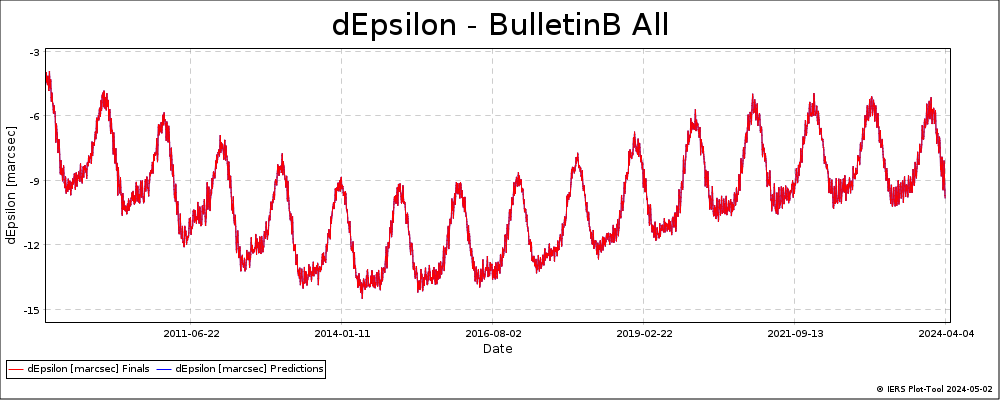
dEpsilon - Bulletin B All
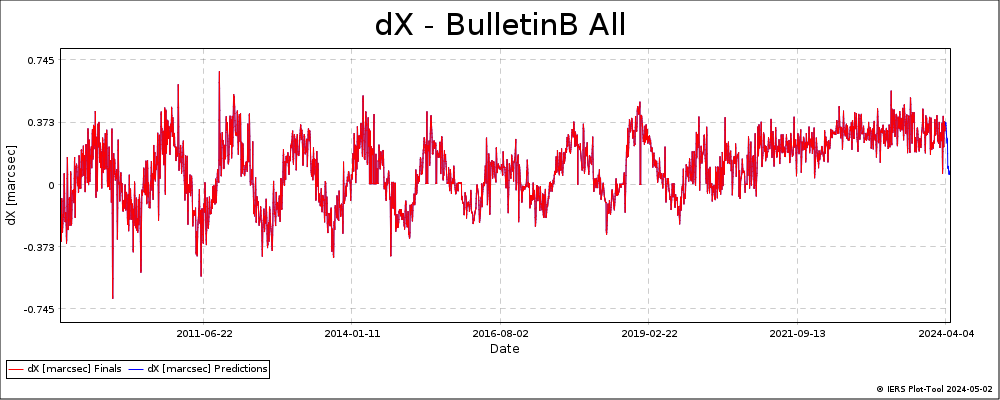
dX - Bulletin B All
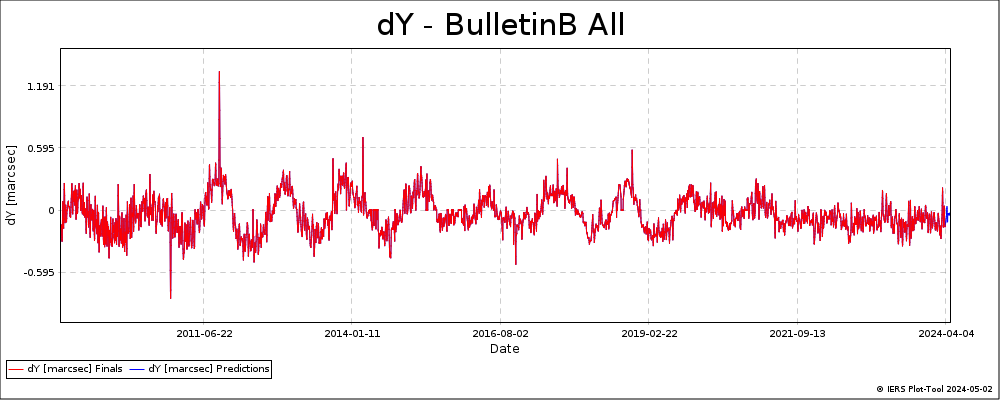
dY - Bulletin B All
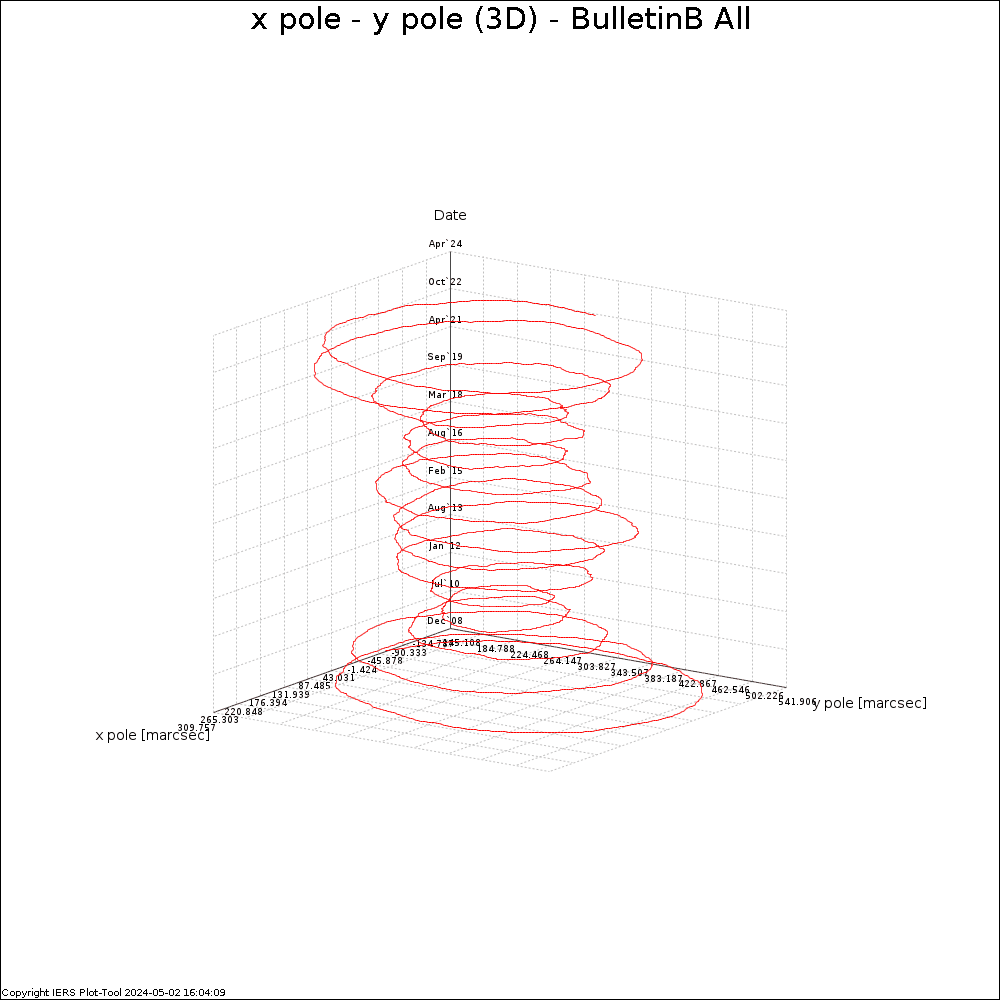
x pole - y pole (3D) - Bulletin B All
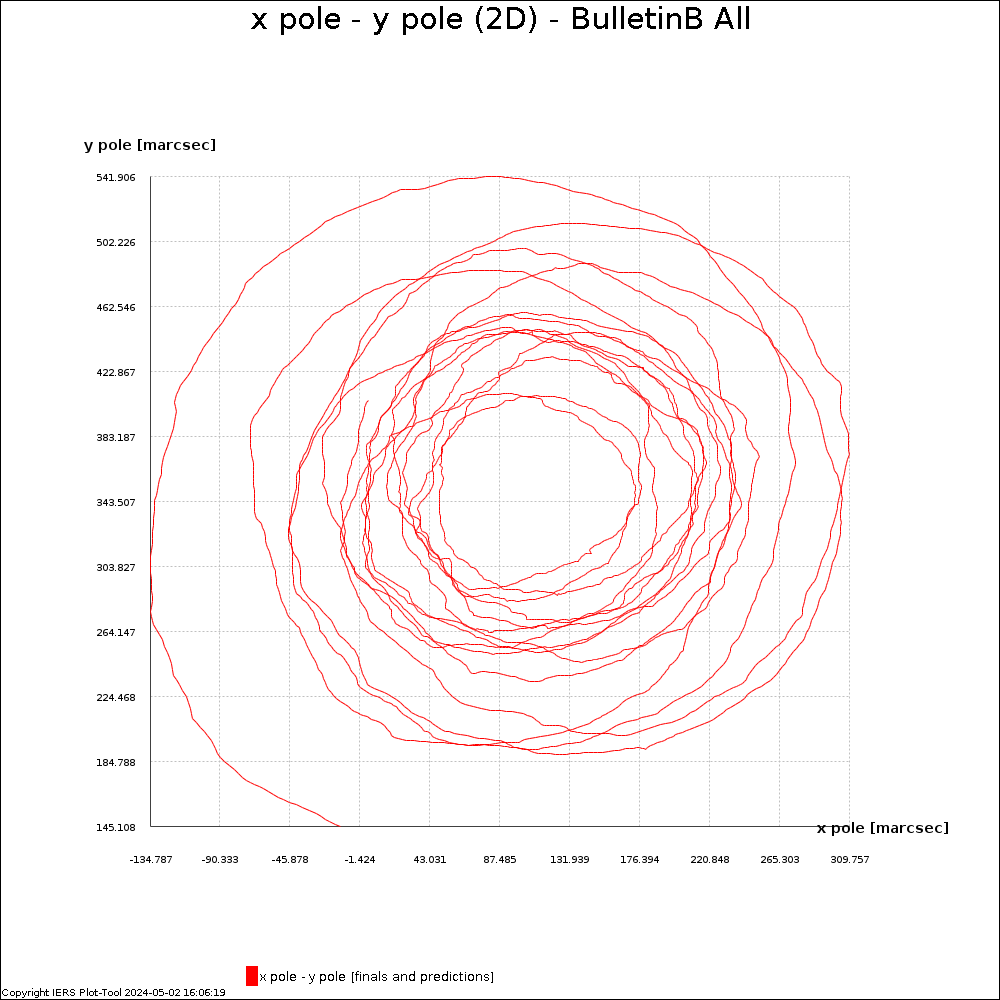
x pole - y pole (2D) - Bulletin B All
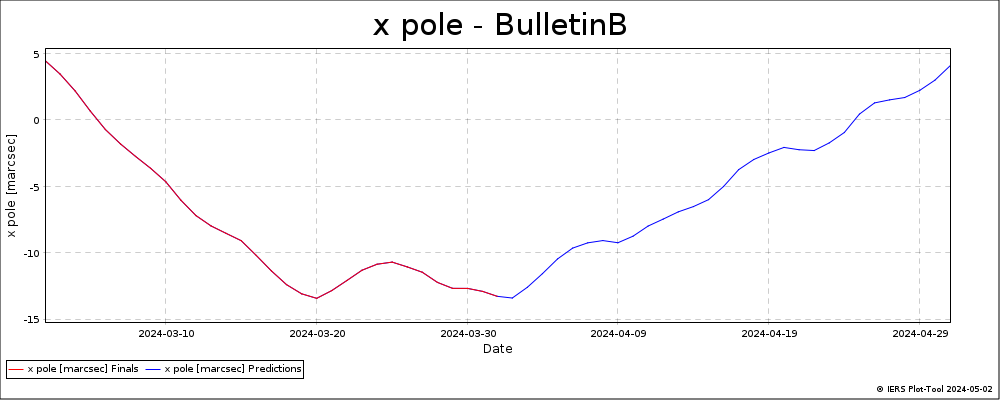
x pole - Bulletin B - latest version
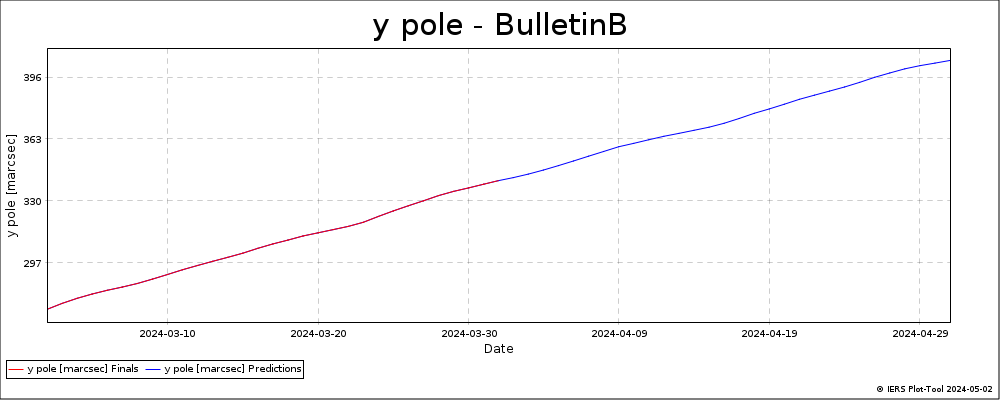
y pole - Bulletin B - latest version
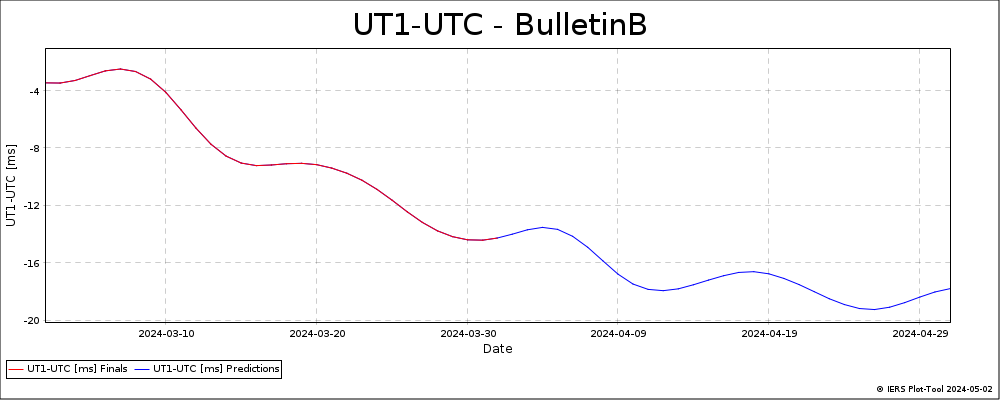
UT1-UTC - Bulletin B - latest version
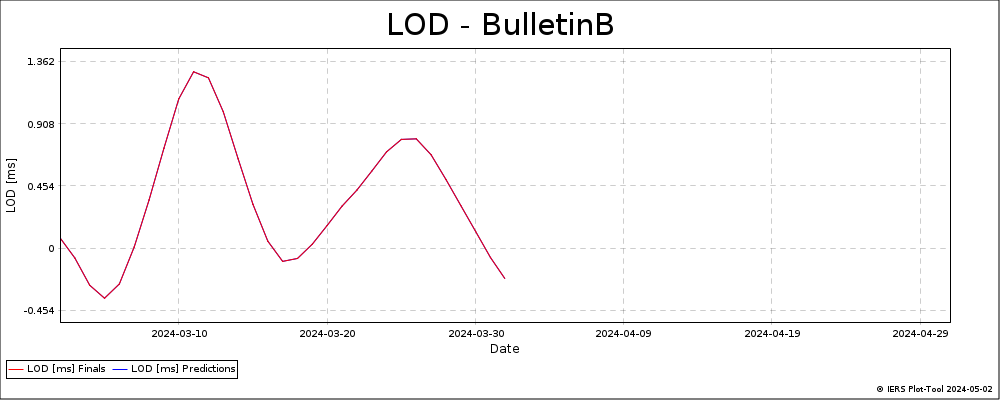
LOD - Bulletin B - latest version
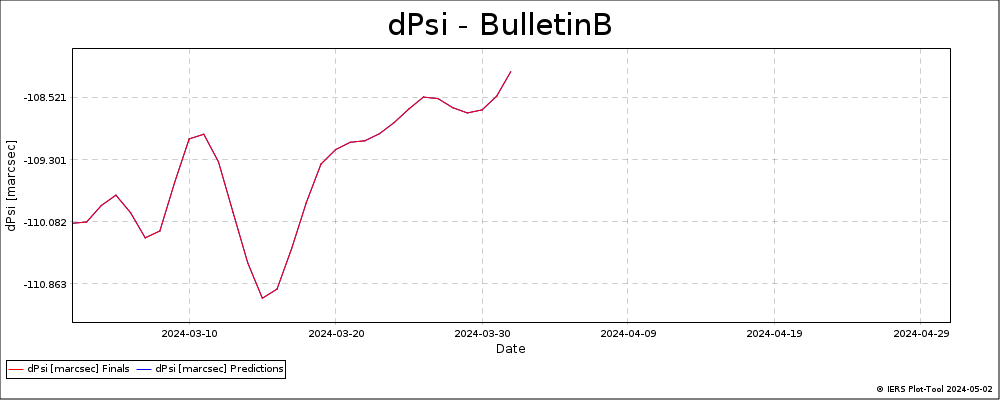
dPsi - Bulletin B - latest version
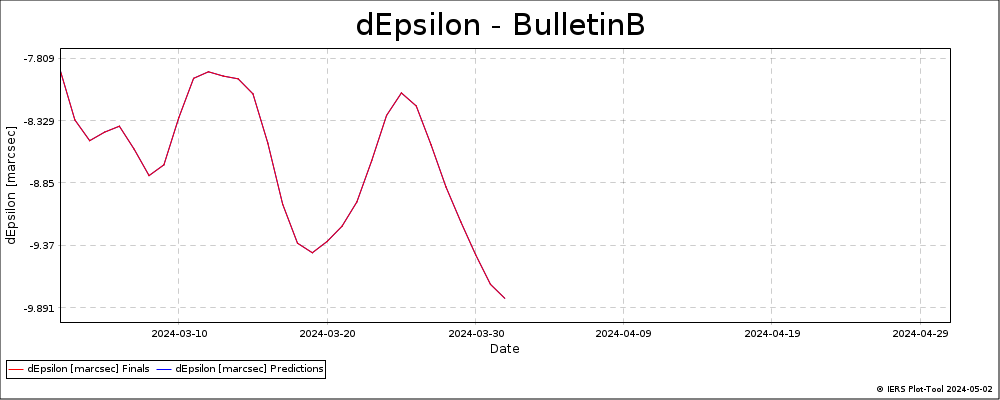
dEpsilon - Bulletin B - latest version
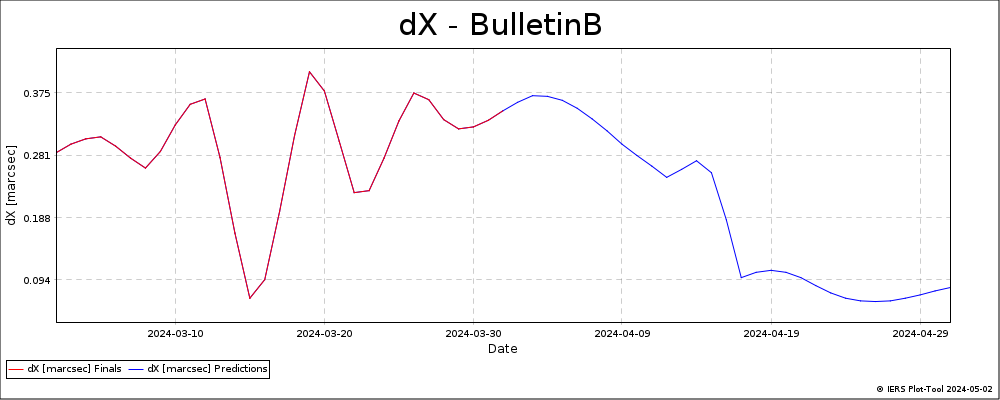
dX - Bulletin B - latest version
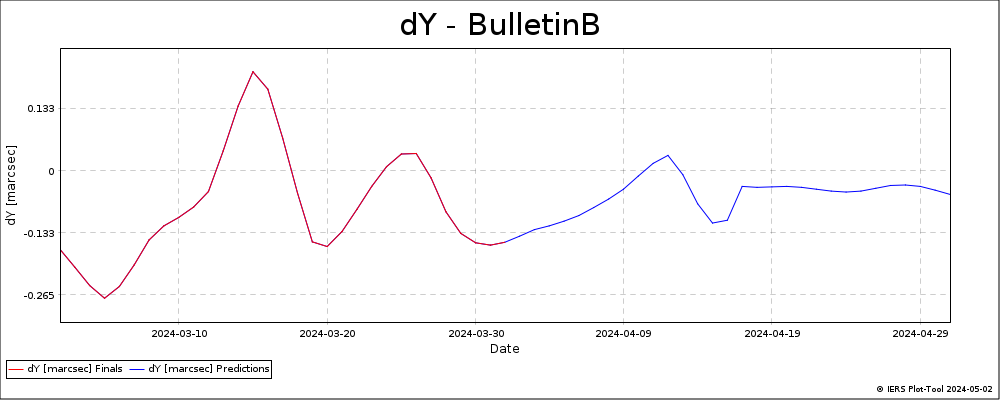
dY - Bulletin B - latest version
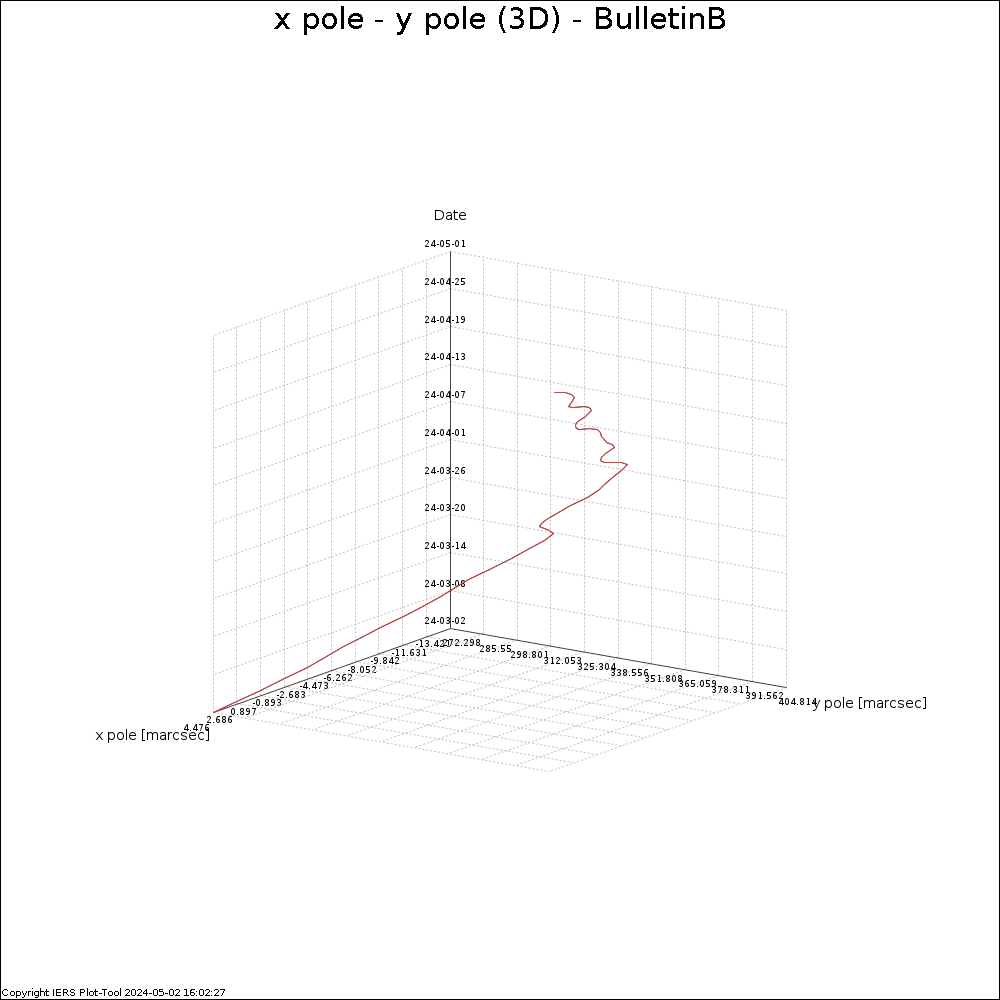
x pole - y pole (3D) - Bulletin B - latest version
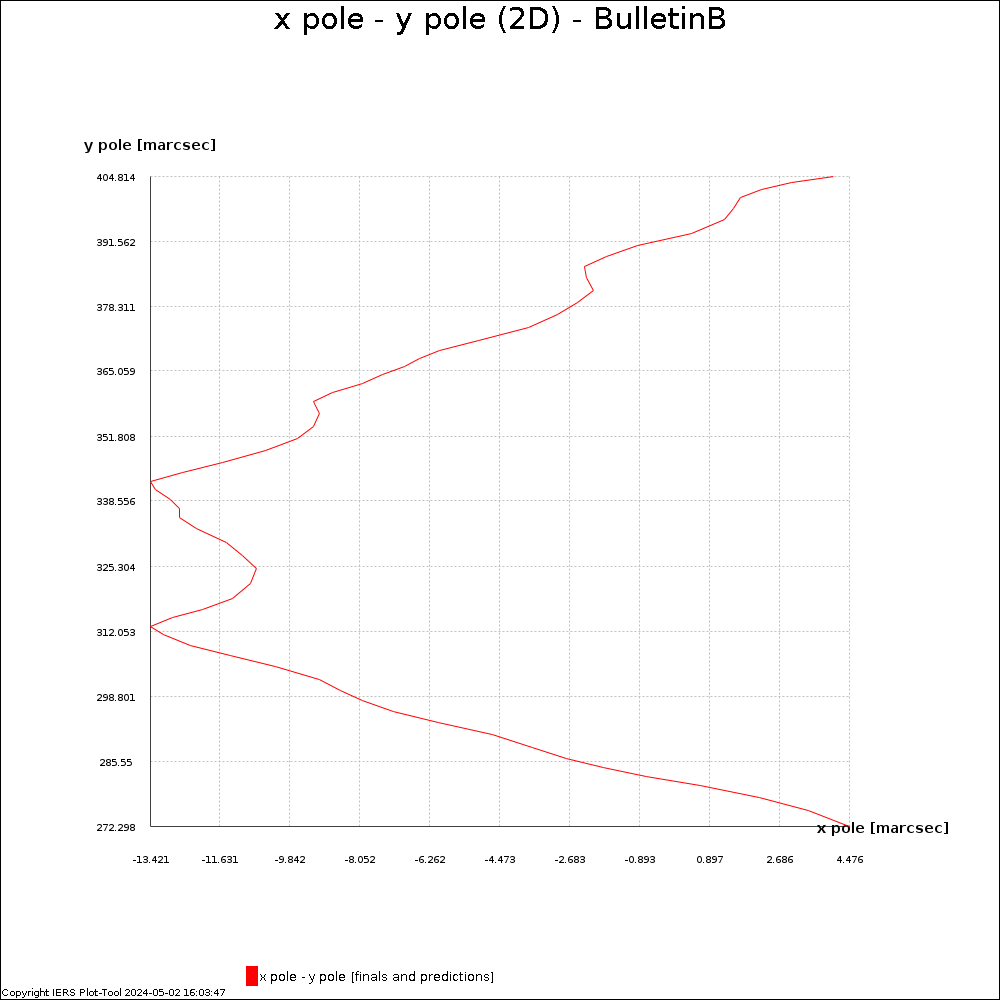
x pole - y pole (2D) - Bulletin B - latest version